
Aave is rebounding sharply and approaching the key resistance zone near $102. Momentum has clearly improved over the past week, with RSI at 65 and MACD turning bullish. If the price clears this level, the move could gain significantly more traction; if it fails, the recovery stays fragile.
Key takeaways in a nutshell
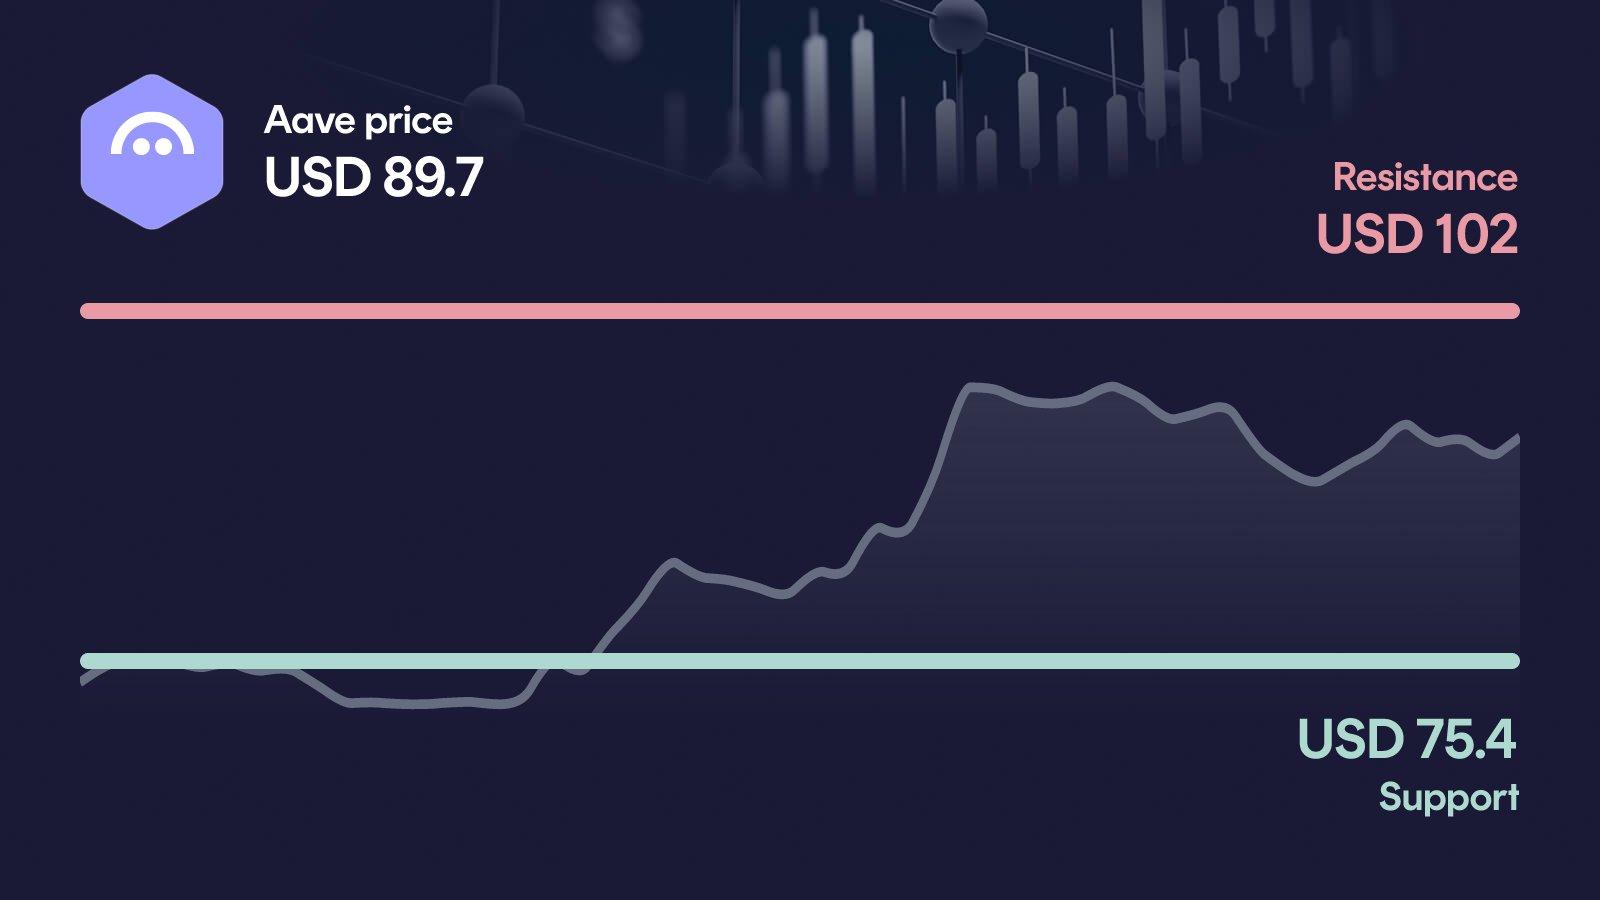
Strong weekly rebound: AAVE trades at $89.70 after a 24% rally over the past 7 days.
Trend remains split: Price sits 12% above the 50-day MA but still 22% below the 200-day MA at $115.
Breakout in focus: Above $102, the setup would improve significantly and open room toward $113.
Momentum building: RSI at 65 and a clearly bullish MACD support the constructive short-term picture.
AI sees upside room: The forecast range for year-end 2026 spans $110 to $181, well above current levels.
What happened to the Aave price?
Aave is trading at $89.70, slightly lower on the day but up a strong 24% over the past 7 days and 8.3% over the past 30 days. The weekly high at $97.90 shows that buyers have already pushed close to the next major resistance, even if the level has not yet been cleared.
The most notable signal is volume: 24-hour turnover sits at $233 million, almost exactly in line with the 30-day average (+5%). That means the rebound is happening on normal participation, not on an exceptional buying spike, which makes the next test of the $102 zone all the more interesting.
Key price levels for Aave
These are the key zones now: The resistance at $102 is the next major hurdle, and a move above it would confirm the breakout and open the path toward the secondary resistance near $113. On the downside, the area around $75.40 acts as primary support, marking the floor of the recent rally. If Aave falls below it, the next relevant level near $59.80 becomes the key reference point and would put the broader recovery in question.
Aave indicators: RSI, MACD and volume
The three indicators currently paint a largely consistent picture. The RSI at 65 sits in the upper half of its range, showing clear strength without yet flashing overbought conditions. The MACD is bullish at 3.49, and the rising histogram confirms that momentum has been steadily building over the past two weeks. Volume sits at +5% versus the 30-day average, which is broadly average and shows participation is solid but not euphoric. Taken together, the indicators support the current recovery, but they also make clear that a clean break above $102 will need stronger conviction from buyers.
Relative Strength Index
MACD
AI forecast for Aave
Looking toward year-end 2026, our AI forecast model places Aave within a wide range from $109.95 to $181.27. The central expected value sits near $141.17, but this figure should not be read as a price target; it is the midpoint of a broad probability distribution.
The range matters more than the single midpoint because it reflects how much the setup could shift depending on whether the current breakout attempt succeeds. In the conservative case, that implies about +23.1% upside from current levels, while the optimistic case points to roughly +103%. The wide spread underlines that the medium-term outlook depends heavily on whether AAVE can decisively reclaim the zone above $100.
What could happen now?
Bullish scenario
If Aave can push through $102 with stronger volume, the breakout would no longer look like a short-term impulse but would be much better supported. The next reference would then be the secondary resistance near $113, which also coincides with the 200-day moving average. For this scenario to stay intact, the RSI should not overheat too quickly and the MACD should keep extending its bullish momentum. The pullback area around $75.40 must then continue to hold to confirm that the trend structure is genuinely shifting.
Trigger: > $102 with elevated volume
Bearish scenario
The decisive level on the downside is $75.40. If this support breaks, the recent rally would lose its foundation, and the short-term setup would clearly worsen. The next relevant reference would then sit around $59.80, near the recent 30-day low. A move into that area would put significant pressure on the medium-term trend and shift the focus back toward the broader weakness that has dominated the chart over the past 200 days.
Trigger: < $75.40
Conclusion: Decision at $102
The technical setup is constructive, but the decisive test still lies ahead. The area between $97.90 and $102 is where this rally either becomes a real trend shift or stalls again.
A clean break above $102 would open the path toward $113 and meaningfully improve the medium-term picture. A failure at this resistance, followed by a loss of the $75.40 support, would expose the move as another lower-high inside the broader downtrend. The next few trading days are likely to set the direction.
Want to buy Aave? Kraken is our recommended crypto trading platform.
Continue to KrakenSince 2017, Philipp Duringer has been deeply involved in Bitcoin, crypto assets and digital financial markets. As the founder of Coinbird, he combines years of crypto experience with more than 15 years of technical experience in IT and digital products. His goal is to make crypto easier to understand, more transparent and easier to compare.
About the authorAI-assisted: This price analysis is generated automatically based on structured market data and reviewed through defined quality rules. It is for informational purposes only and is not financial or investment advice or a recommendation to buy or sell crypto assets.